Poisson Distribution is a mathematical concept for translating mean averages into a probability for variable outcomes across a distribution. For example, if we know Manchester City average 1.7 goals per game, so by putting the Poisson Distribution formula tells us that this average equates to Manchester City scoring 0 goals 18.3% of the time, 1 goal 31% of the time, 2 goals 26.4% of the time and 3 goals 15% of the time.
Poisson Distribution - Calculating score-line probabilities Before we can use Poisson to calculate the most likely score-line of a match, we need to calculate the average number of goals each team is likely to score in that match. This can be calculated by determining the “Attack Strength” and “Defence Strength” for each team and comparing them.
Selecting a representative data range is vital when calculating Attack Strength and Defence Strength – too long and the data will not be relevant for the team's current strength, while too short may allow outliers to skew the data. The 38 games played by each team in the 2015/16 EPL season will provide a sufficient sample size to apply the Poisson Distribution.
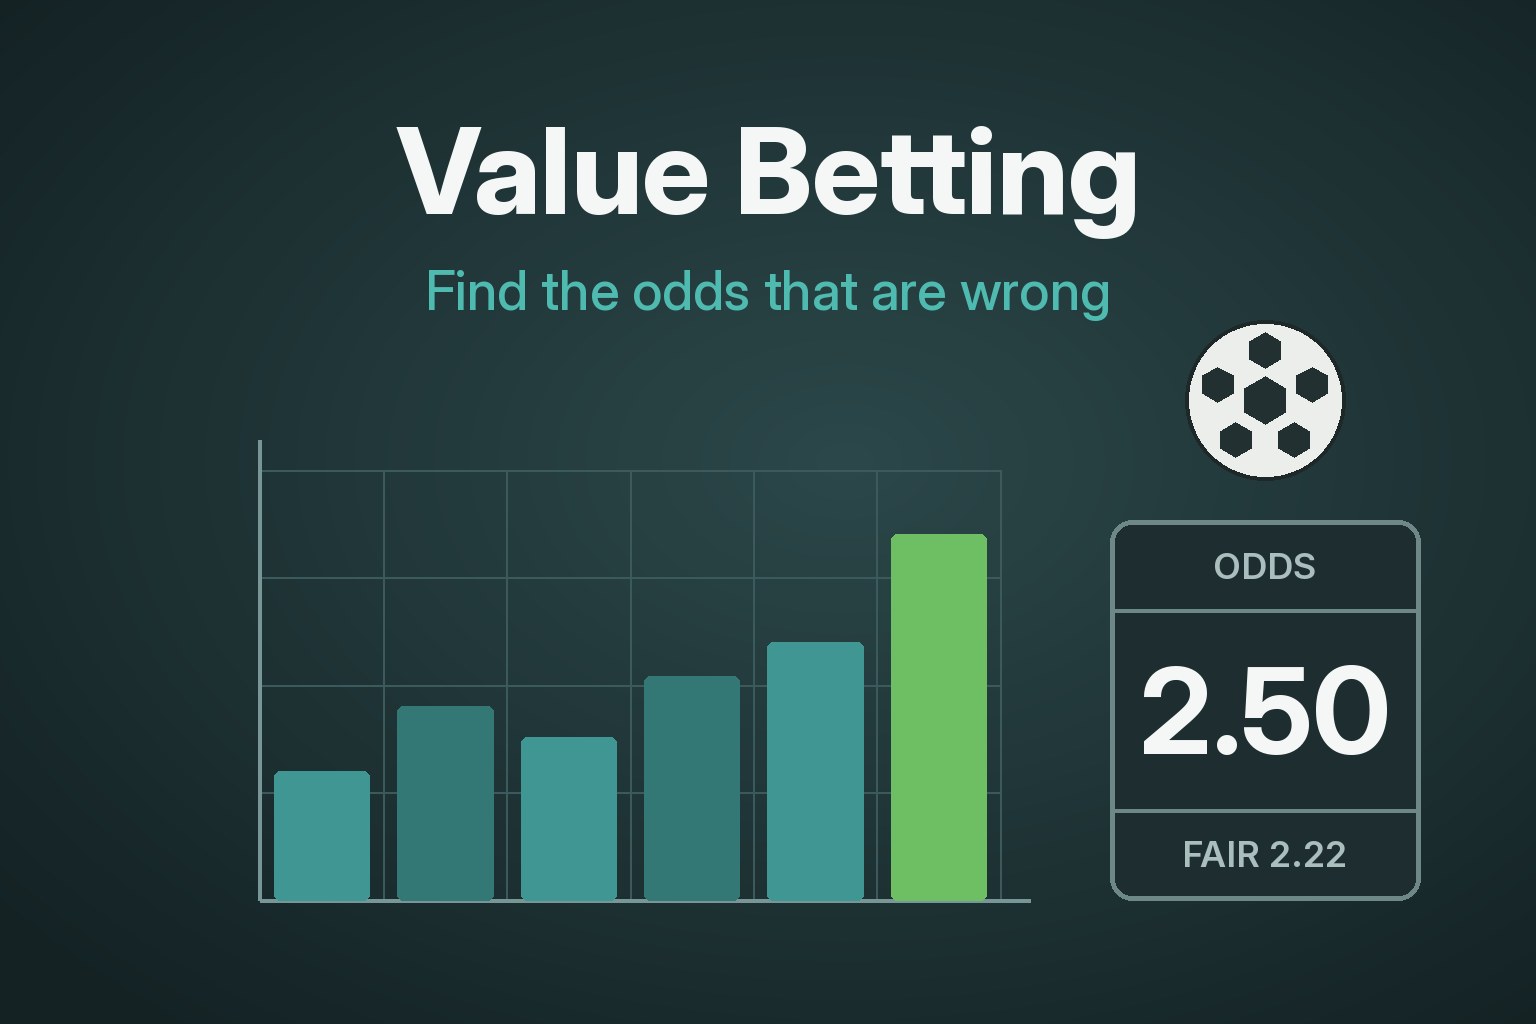
Once you know how to calculate result probabilities, you can compare your results to a bookmaker’s odds and potentially find value.
How to calculate Attack Strength The first step in calculating Attack Strength based upon last season’s results is to determine the average number of goals scored per team, per home game, and per away game.
Calculate this by taking the total number of goals scored last season and dividing it by the number of games played:
Season total goals scored at home / number of games (in season) Season total goals scored away / number of games (in season) In 2015/16 English Premier League season, there were 567/380 at home and 459/380 away, equalling an average of 1.492 goals per game at home and 1.207 away.
Average number of goals scored at home: 1.492 Average number of goals scored away: 1.207 The ratio of a team's average and the league average is what constitutes “Attack Strength”.
How to calculate Defence Strength We’ll also need the average number of goals an average team concedes. This is simply the inverse of the above numbers (as the number of goals a home team scores will equal the same number that an away team concedes):
Average number of goals conceded at home: 1.207 Average number of goals conceded away from home: 1.492 The ratio of a team's average and the league average is what constitutes "Defence Strength".
We can now use the numbers above to calculate the Attack Strength and Defence Strength of both Tottenham Hotspur and Everton (as of 1st March 2017).
Predicting Tottenham Hotspur’s goals
Calculate Tottenham’s Attack Strength:
Step - 1: Take the number of goals scored at home last season by the home team (Tottenham: 35) and divide by the number of home games (35/19): 1.842. Step - 2: Divide this value by the season’s average home goals scored per game (1.842/1.492) to get an “Attack Strength” of 1.235. (35/19) / (567/380) = 1.235
Calculate Everton’s Defence Strength:
Step - 1: Take the number of goals conceded away from home last season by the away team (Everton: 25) and divide by the number of away games (25/19): 1.315. Step - 2: Divide this by the season’s average goals conceded by an away team per game (1.315/1.492) to get a “Defence Strength” of 0.881. (25/19) / (567/380) = 0.881
We can now use the following formula to calculate the likely number of goals Tottenham might score (this is done by multiplying Tottenham's Attack Strength by Everton's Defence Strength and the average number of home goals in the Premier League):
1.235 x 0.881 x 1.492 = 1.623
Predicting Everton’s goals To calculate the number of goals Everton might score, simply use the above formulas but replace the average number of home goals with the average number of away goals.
Everton's Attack Strength:
(24/19) / (459/380) = 1.046
Tottenham's Defence Strength:
(15/19) / (459/380) = 0.653
In the same way we predicted the number of goals Tottenham will score, we can calculate the likely number of goals Everton might score (done by multiplying Everton's Attack Strength by Tottenham's Defence Strength and the average number of away goals in the Premier League):
1.046 x 0.653 x 1.207 = 0.824
The limits of Poisson Distribution Poisson Distribution is a simple predictive model that doesn’t allow for numerous factors. Situational factors – such as club circumstances, game status etc. – and subjective evaluation of the change of each team during the transfer window are completely ignored.
In this case, the above Poisson formula calculation fails to quantify any effect Everton's new manager (Ronald Koeman) might have had on the team. It also fails to take Tottenham's potential fatigue into consideration now that they are playing close to a Europa League fixture.
Correlations are also ignored; such as the widely recognised pitch effect that shows certain matches have a tendency to be either high or low scoring.
These are particularly important areas in lower league games, which can give bettors an edge against bookmakers. It is harder to gain an edge in major leagues such as the Premier League given the expertise and resources that modern bookmakers have at their disposal.